Four tools promise to tell you what is happening on Product Hunt. We opened every one of them on 2026-09-07, expecting to end up comparing feature lists, and ended up somewhere else entirely.
Every tool below reads the same public Product Hunt GraphQL API, under the same published rate limit. Not similar data. The same data, from the same endpoint.
Which means the question "which one has better data" is not a real question. The real question is what each one does with an identical firehose, and that splits them into two different jobs that most founders confuse for one.
The four
| Tool | What it's for | Published price | Pre-launch or launch day |
|---|---|---|---|
| Hunted.space | Launch calendar, historical rankings, hunter profiles, live upvote and comment stats | None published | Both |
| ProductHuntr | Keyword and category tracking, alert rules, 2-year history, data export | Analytics $29/month; White Glove and Enterprise contact sales | Both |
| App Scout | Category trend analysis, market concentration metrics, competitor positioning | Free, no account | Pre-launch |
| Catch The Signal | Hourly-refreshed feed of top launches, trending products, new makers | None published | Launch day |
The column that matters most is the last one, and it is the column nobody reads. Three of these four will happily show you a number ticking upward on launch day, and watching that number is emotionally satisfying and operationally useless, because by then every decision that determines the number has already been made. Your category, your launch date, your positioning against whatever else ships that morning. Those are pre-launch decisions. If you only install a tool the night before, you bought a scoreboard.
Hunted.space: the one that covers the most ground
Hunted.space was serving launch data dated 2026-09-06 when we checked, so it is current, not a zombie site with a stale cache.
What it actually does spans both jobs. On the launch-day side there is a dashboard with upvote and comment stats plus upvote speed, which is the derivative rather than the raw count and therefore slightly more informative than a plain counter. On the pre-launch side there is a launch calendar, historical data broken out daily, weekly and monthly, and rankings by week, month and year. There is an upcoming products tracker and there are hunter profiles with stats attached.
That hunter angle deserves attention.
Most tools treat launches as isolated events. Hunted.space lets you look at the people who repeatedly hunt products in your space, which is a different query than "what launched today."
One number on its front page is worth the visit on its own. On 2026-09-06 it showed 536 products featured and 529 removed the same day. Roughly half of what gets submitted does not survive to the board, and no other tool on this list surfaces that ratio.
There are exactly four guide articles on the site: a step-by-step video tutorial, "How to win on Product Hunt", "How to build, launch & grow", and "How to choose Product Hunt launch day." Four is not a content library. It is a starter kit, and if you were hoping the tool came with a body of strategic writing, adjust down.
Pricing is the awkward part. There is none published anywhere on the site. You can use it without paying, and we did, but "no published pricing" and "free" are different statements and we are only going to make the one we can support. If you are building a workflow around this tool, that ambiguity is a risk you should price in.
As of September 2026, Hunted.space is the broadest single tool on this list.
ProductHuntr: the paid one, and the only one with a stated number
ProductHuntr reports "System Operational" on its status display, which is a small thing but it is the kind of small thing that only appears on products someone is still running.
The price is $29/month for the Analytics tier. White Glove and Enterprise are contact-sales. That is worth stating plainly, because ProductHuntr often gets described as "pricing on request" and it is not; the number is published on the site. The pricing page lists no free tier.
Feature-wise this is the most instrumented of the four. The $29 Analytics tier covers keyword analysis, product and category tracking, trend alerts, two years of history, watchlists, and data export.
Read the tier boundary carefully, because this is where a roundup will mislead you if it just merges every feature into one list. API access, custom reporting, custom data pipelines and dedicated support are not in the $29 plan. They sit in White Glove, which is contact-sales with no published number. If your plan involves pulling launch data into your own warehouse on a schedule, the price of that is a sales call, not $29.
The distinguishing piece is a "Predictive Momentum" score, which the product describes as combining velocity, Z-score, acceleration, and category baselines. That is a real statistical construction rather than a vague label. Whether the prediction is any good is not something we can verify from outside, and we are not going to pretend otherwise, but the inputs are at least the inputs you would pick if you were building it seriously.
What the $29 tier does give you that nothing else here does is data export. Every other tool on this list is a website you look at. Export is the difference between a dashboard and something you can join against your own funnel numbers in a spreadsheet, and that alone is the reason to consider paying.
If you launch more than twice a year, or you are running launches for clients, $29/month against a single failed launch slot is not a close call.
App Scout: the research tool, and ours
Disclosure: App Scout is built by us, Kolee. Treat everything below with that in mind, and note that we are also going to tell you exactly what it does not do.
App Scout is free, requires no account, and pointed at a different question than the rest of this list. It does not care what happened this morning. It cares what the shape of a category has looked like over weeks.
The live dashboard as of 2026-09-07 reads: 173.7K total apps indexed, 487 topics, 59 active categories tracked this week, and 5.1K apps launched in the last seven days.
Trend windows run 7, 14, 30 and 90 days, and the longer windows are the point. A 7-day view of Product Hunt is mostly noise from whoever happened to ship on a Tuesday.
The Market Overview panel is where the tool earns its keep. For the seven days ending 2026-09-07: market growth is -10.1% against the previous 7-day window, the diversity index sits at 3.48 with 85% evenness, and the HHI concentration index is 480, labelled "competitive market." Zero new categories emerged in that window. HHI is the standard antitrust concentration measure, and seeing it applied to launch categories is unusual; 480 means no single category dominates, which is a different market to launch into than a concentrated one.
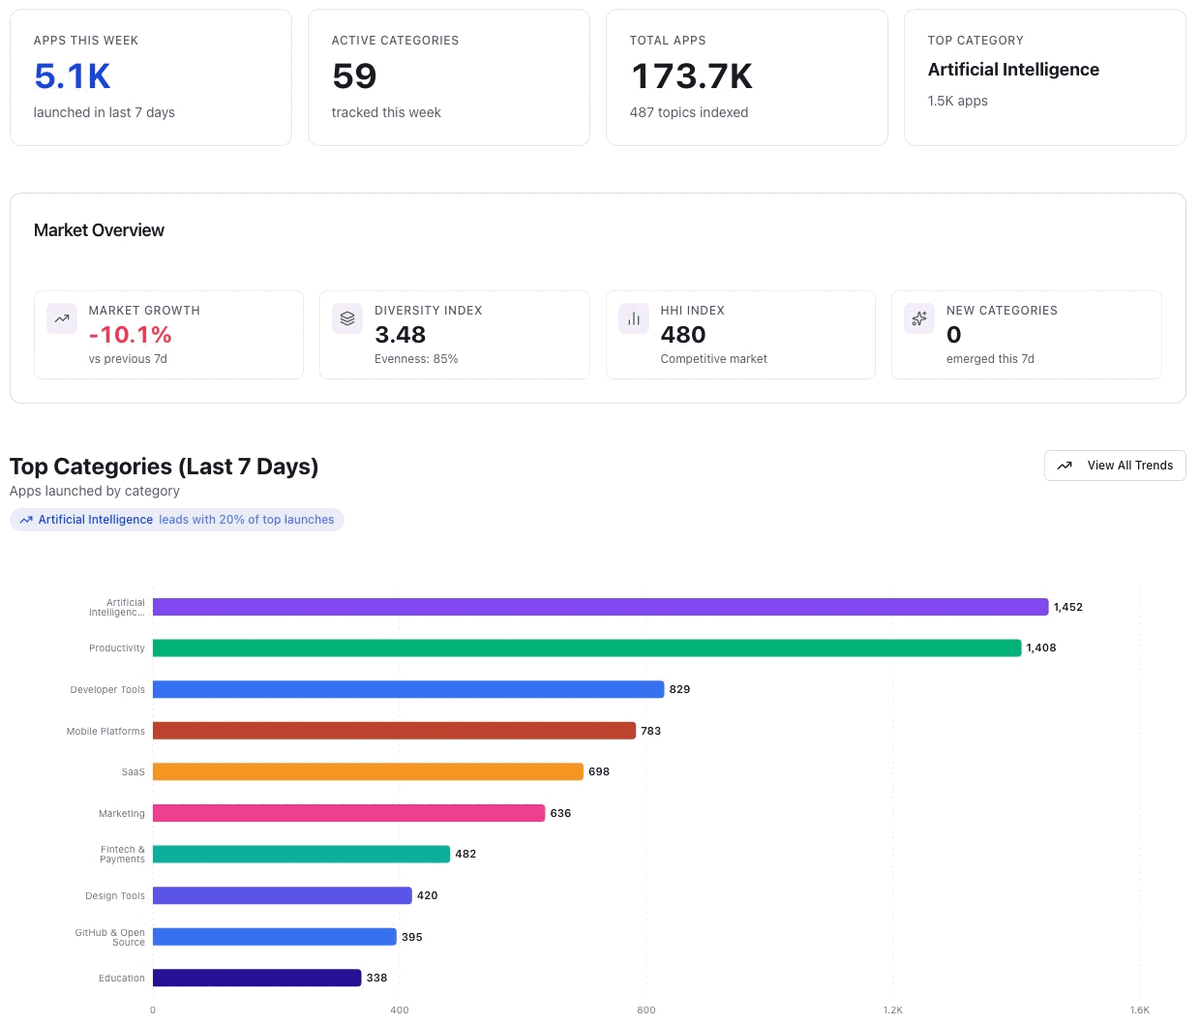
The category table for the same window is more directly actionable. Artificial Intelligence 1,452 launches, Productivity 1,408, Developer Tools 829, Mobile Platforms 783, SaaS 698. Now look at the direction rather than the size: AI -9.8%, Productivity -14.0%, Developer Tools -8.3%, Mobile Platforms -10.4%. Four of the five biggest categories are contracting week over week.
SaaS went the other way. Up 1.6%, 698 apps this period against 687 the period before, and it is the only one of the five that is not shrinking.
Here is the part that matters more than the row itself. Ten days earlier we ran the same panel and got a different answer: on 2026-08-28, Marketing was the riser at plus 18 percent and SaaS was down 12.4 percent. Those two have since traded places. Neither reading was wrong. A seven-day window simply turns over fast enough that any number printed in a blog post, including the ones in this paragraph, is a snapshot and not something you can plan against. Open the panel in the week you are actually deciding.
That is also the argument for the tool rather than the article. If you have a product that could plausibly be filed under either SaaS or Marketing, one of those categories is thinning out and the other is filling up on any given week, and the only way to know which is to look at the current window.
There is also a Compete section that positions your product against similar ones by description similarity, and a weekly newsletter covering category highlights alongside quiet categories. The footer states the data source is Product Hunt and that it updates daily.
Now the honest part. App Scout has no launch-day real-time tracking. No predictive scoring. No alerting of any kind. If your product is going live in four hours and you want something that pings you when a competitor overtakes you, this is the wrong tab to have open. It is a research tool for the two weeks before you launch, and it is deliberately not a monitor.
Catch The Signal: narrow, hourly, no signup
Catch The Signal's Product Hunt tracker page returns HTTP 200 as of 2026-09-07, as does the main site. It shows today's top launches, trending products, and new makers, refreshed hourly, with no signup required.
The Product Hunt tracker is one feed inside a wider product that also covers startup jobs, funding rounds, bug bounties, and open-source opportunities.
One thing to get right, because it is easy to get wrong: the "10+ sources" line on the site refers to those jobs, funding and bounty feeds. It does not mean the tool monitors ten platforms for Product Hunt signal. We misread it that way ourselves before checking the sources page.
No paid pricing that we could find. Hourly refresh is the constraint that defines it - fine for a morning scan, not fine for a launch you are actively steering.
They are all reading the same firehose
This is the part that reframes everything above.
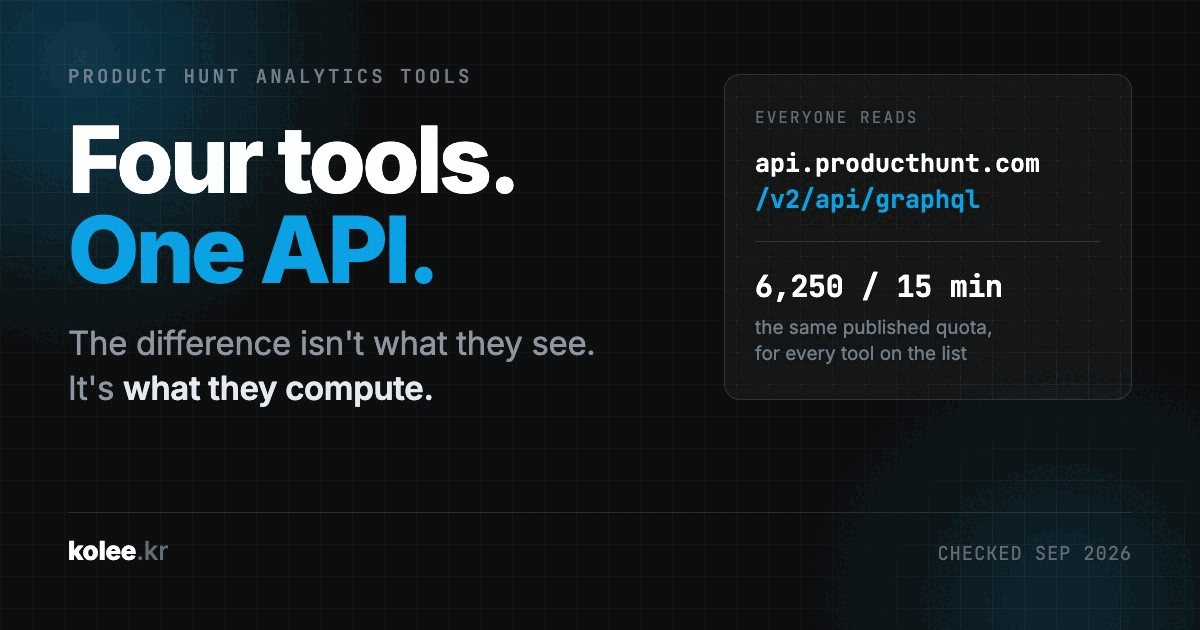
Product Hunt exposes one public API: v2, GraphQL, at api.producthunt.com/v2/api/graphql. The old v1 REST API is deprecated. Per Product Hunt's own documentation, the published quota is 6,250 complexity points per 15 minutes, and 450 requests per 15 minutes on other v2 endpoints.
Every tool in this article is behind that endpoint and that quota. There is no premium data feed. There is no partner tier with early access to launches. Nobody here has a scraper pulling something the others cannot reach, because the interesting fields are simply not in the schema for anyone.
The consequences are worth spelling out, because vendor marketing works hard to obscure them.
First, "more data" is not a differentiator anyone on this list can honestly claim. If two tools show you different upvote counts for the same product, one of them is stale, not better informed.
Second, refresh rate is a real difference, and it is a difference in engineering budget rather than data access. Catch The Signal refreshes hourly. Hunted.space appears to run considerably tighter on its live dashboard. That gap is about how each team chooses to spend its 6,250 points, not about what either can see.
Third, and most importantly: the actual product is the transformation. ProductHuntr's Z-scores and category baselines, App Scout's HHI and diversity index, Hunted.space's hunter profiles and featured-versus-removed ratio, none of those exist in the API. They are all derived. Every one of these companies took the identical raw feed and decided what was worth computing from it, and that decision is the entire product.
So when you evaluate these tools, do not ask what they know. Ask what they compute.
A quick note on context, hedged because we could not source it properly. There are reports circulating that Product Hunt's ranking now weights comment quality, vote velocity and account trust more heavily than raw upvote count, and claims that outcomes concentrate sharply by rank. We found no primary Product Hunt announcement for any of it, only marketing blogs citing each other. Treat it as rumor, not input.
What none of them can see
Four tools, one API, and a set of blind spots that all four share exactly.
None of them can see the newsletter inclusion decision. Product Hunt's daily newsletter drives a meaningful share of launch-day traffic for the products it features, and the selection is not exposed through the API in any form. No tool can predict it, detect it, or explain it after the fact.
Trust weighting is the same story. If the ranking really does discount votes from low-trust accounts, that scoring lives entirely server-side. The API returns a vote count. It does not return a weighted vote count, a per-voter trust score, or any signal about which of your votes counted.
And none of them can see where your traffic went. This is the expensive one. Every tool here can tell you that you got 400 upvotes. Not one can tell you that 40 of those people visited your pricing page and three of them signed up, because that data lives in your analytics, not Product Hunt's.
That gap only closes one way, and it is not a tool purchase. Tag your Product Hunt link with UTM parameters before you launch. Set up the conversion event beforehand, not the morning after. Otherwise you will finish launch day with a ranking and no idea whether it was worth anything.
Skip the UTM discipline and every number in this article is vanity.
Which one, by situation
You launch in two weeks and have not picked a category or a date. App Scout. The 30 and 90-day trend windows and the category direction data are built for exactly this decision, and it costs nothing to check.
Launching regularly, or running launches for other people? ProductHuntr at $29/month, for the data export. That is the one feature here that lets you pull launch numbers into the same sheet as your own funnel. If you need API access rather than manual export, budget for the contact-sales tier instead, because it is not in the $29 plan.
You want one tool and do not want to think about it. Hunted.space. It covers pre-launch calendar work and launch-day stats in one place, though the absence of published pricing is a real unknown to carry.
You want a passive morning scan of what shipped. Catch The Signal. Hourly refresh, no account, low commitment.
You want a big upvote counter on a screen in the office. Hunted.space's live dashboard is the closest thing here, and it is the only one of the four built to be watched rather than read.
If you only do one thing from this article: spend the free thirty minutes on category research before you lock your launch date, instead of the paid subscription on watching a counter you can no longer influence.
App Scout is free at appscout.kolee.kr, no account needed.